ChemometricSolutions - Software

CAT

CAT (Chemometric Agile Tool) is our R-based chemometric software, designed to bridge the gap between complex statistical theory and practical applications. Initially developed by R. Leardi, C. Melzi, G. Polotti, CAT provides a user-friendly interface while maintaining powerful analytical capabilities.

Our software is specifically designed for researchers, quality control specialists, and industry professionals who need to extract meaningful information from complex chemical data without requiring advanced programming skills.

Key Benefits:

  • Intuitive interface that guides users through the analysis process, one of the most used for teaching in universities
  • Comprehensive suite of multivariate analysis techniques
  • Integrated experimental design tools
  • Free and open-source, making it accessible to everyone
  • Regular updates and community support
CAT Software Interface

Powerful Features

Discover the capabilities that make CAT the tool of choice for chemical data analysis

Multivariate Analysis

Comprehensive suite of techniques including PCA, PLS, PCR, and discriminant analysis, with intuitive visualization of results and detailed interpretation guides.

Experimental Design

Tools for designing efficient experiments through the MLR-DoE menu, including D-optimal design.

Transformations

The most commonly used routines in chemometrics for row and column transformations.

Classification Models

Build classification models using k-NN, LDA, QDA, class-modelling with comprehensive validation tools.

Data Visualization

Interactive and customizable plots including score plots, loading plots, influence plots, and correlation loadings to help you gain insights from your data.

Data Import/Export

Flexible import capabilities supporting various file formats (CSV, Excel, TXT) and export options for results, models, and graphics for seamless integration with other tools.

How It Works

A simple workflow that guides you from data to insights

1

Import Your Data

Start by importing your dataset in various formats (CSV, Excel, text files). CAT provides initial summary and univariate statistics to help you understand your data.

2

Preprocess and Explore

Apply the appropriate preprocessing techniques (scaling, centering, transformations). Use exploratory tools like PCA to visualize the data structure and identify patterns.

3

Build and Validate Models

Develop predictive or classification models. CAT provides comprehensive validation tools to ensure your models are robust and reliable.

4

Experimental Design (DoE)

Discover the MLR-DoE menu to discover the potential.

Learning Resources

Materials to help you get the most out of our software

Video Tutorials

Step-by-step video guides demonstrating how to use the software for various applications.

Watch Tutorials

Documentation

Comprehensive reference materials for all features of CAT (istructions.pdf).

View Documentation

Example Datasets

Sample datasets with case studies to help you practice and understand different analytical techniques (working.rar).

Download Examples

What Users Say

Feedback from professionals using our software in their work

CAT is a helpful and loyal companion. Its user-friendly design and the clear readabilty of its outputs are the reasons why I use it every day in pharmaceutical development.

Dr. Diego Copelli, PhD

Dr. Diego Copelli, PhD

R&D, Senior Scientist, Chiesi Farmaceutici

As a university professor, I find CAT invaluable for teaching chemometrics. Its intuitive interface allows students to focus on understanding the concepts rather than struggling with the software.

Prof. Lisa Magnaghi, PhD

Prof. Lisa Magnaghi, PhD

Analytical Chemistry Department, University of Pavia

The Experimental Design tools (MLR-DOE) in CAT have transformed our department's approach to research. We can now develop studies with greater objectivity and methodological rigor.

Dr. Elena Conti

Dr. Matilde Cirignano, PhD

Researcher R&D, HA Italia

Frequently Asked Questions

Find answers to common questions about our software

What operating systems does CAT support?

CAT is compatible with Windows (7, 8, 10, and 11); macOS ONLY with virtual machine.

Do I need programming skills to use CAT?

No, CAT is designed with a user-friendly graphical interface that doesn't require programming knowledge. All features are accessible through intuitive menus and dialogs.

How does CAT compare to other commercial software?

CAT offers comparable functionality to many commercial packages while remaining free and open-source. Our focus is on making advanced chemometric techniques accessible and easy to use. While some specialized commercial packages may offer additional industry-specific features, CAT provides all the essential tools needed for most chemometric analyses.

How can I get support if I encounter issues?

We offer multiple support channels for CAT users. For more urgent issues, you can contact our support team directly via email.

Is CAT suitable for teaching chemometrics?

Absolutely! CAT is widely used in educational settings by many experts (academic and industrial).

How often is CAT updated?

We release major updates approximately twice a year, with minor updates and bug fixes released as needed. Our development roadmap is influenced by user feedback and advancements in the field of chemometrics. We're committed to keeping CAT at the forefront of chemometric software.

Custom Software Development

Tailored web applications and analytical tools designed specifically for your needs

Web Applications

We develop custom web applications using Python and Streamlit platform, a powerful framework that allows us to create interactive, user-friendly interfaces for complex chemometric analyses. Our applications are designed to:

Web-Based Accessibility

Access your custom tools from anywhere through a web browser, with no need for software installation or maintenance

Industry-Specific Solutions

Applications tailored to pharmaceutical, food, chemical, and environmental industry requirements and workflows

Interactive Dashboards

Real-time data visualization and analysis with user-friendly interfaces that make complex statistics accessible

System Integration

Seamless integration with your existing databases, LIMS systems, and analytical instruments

Example Applications:

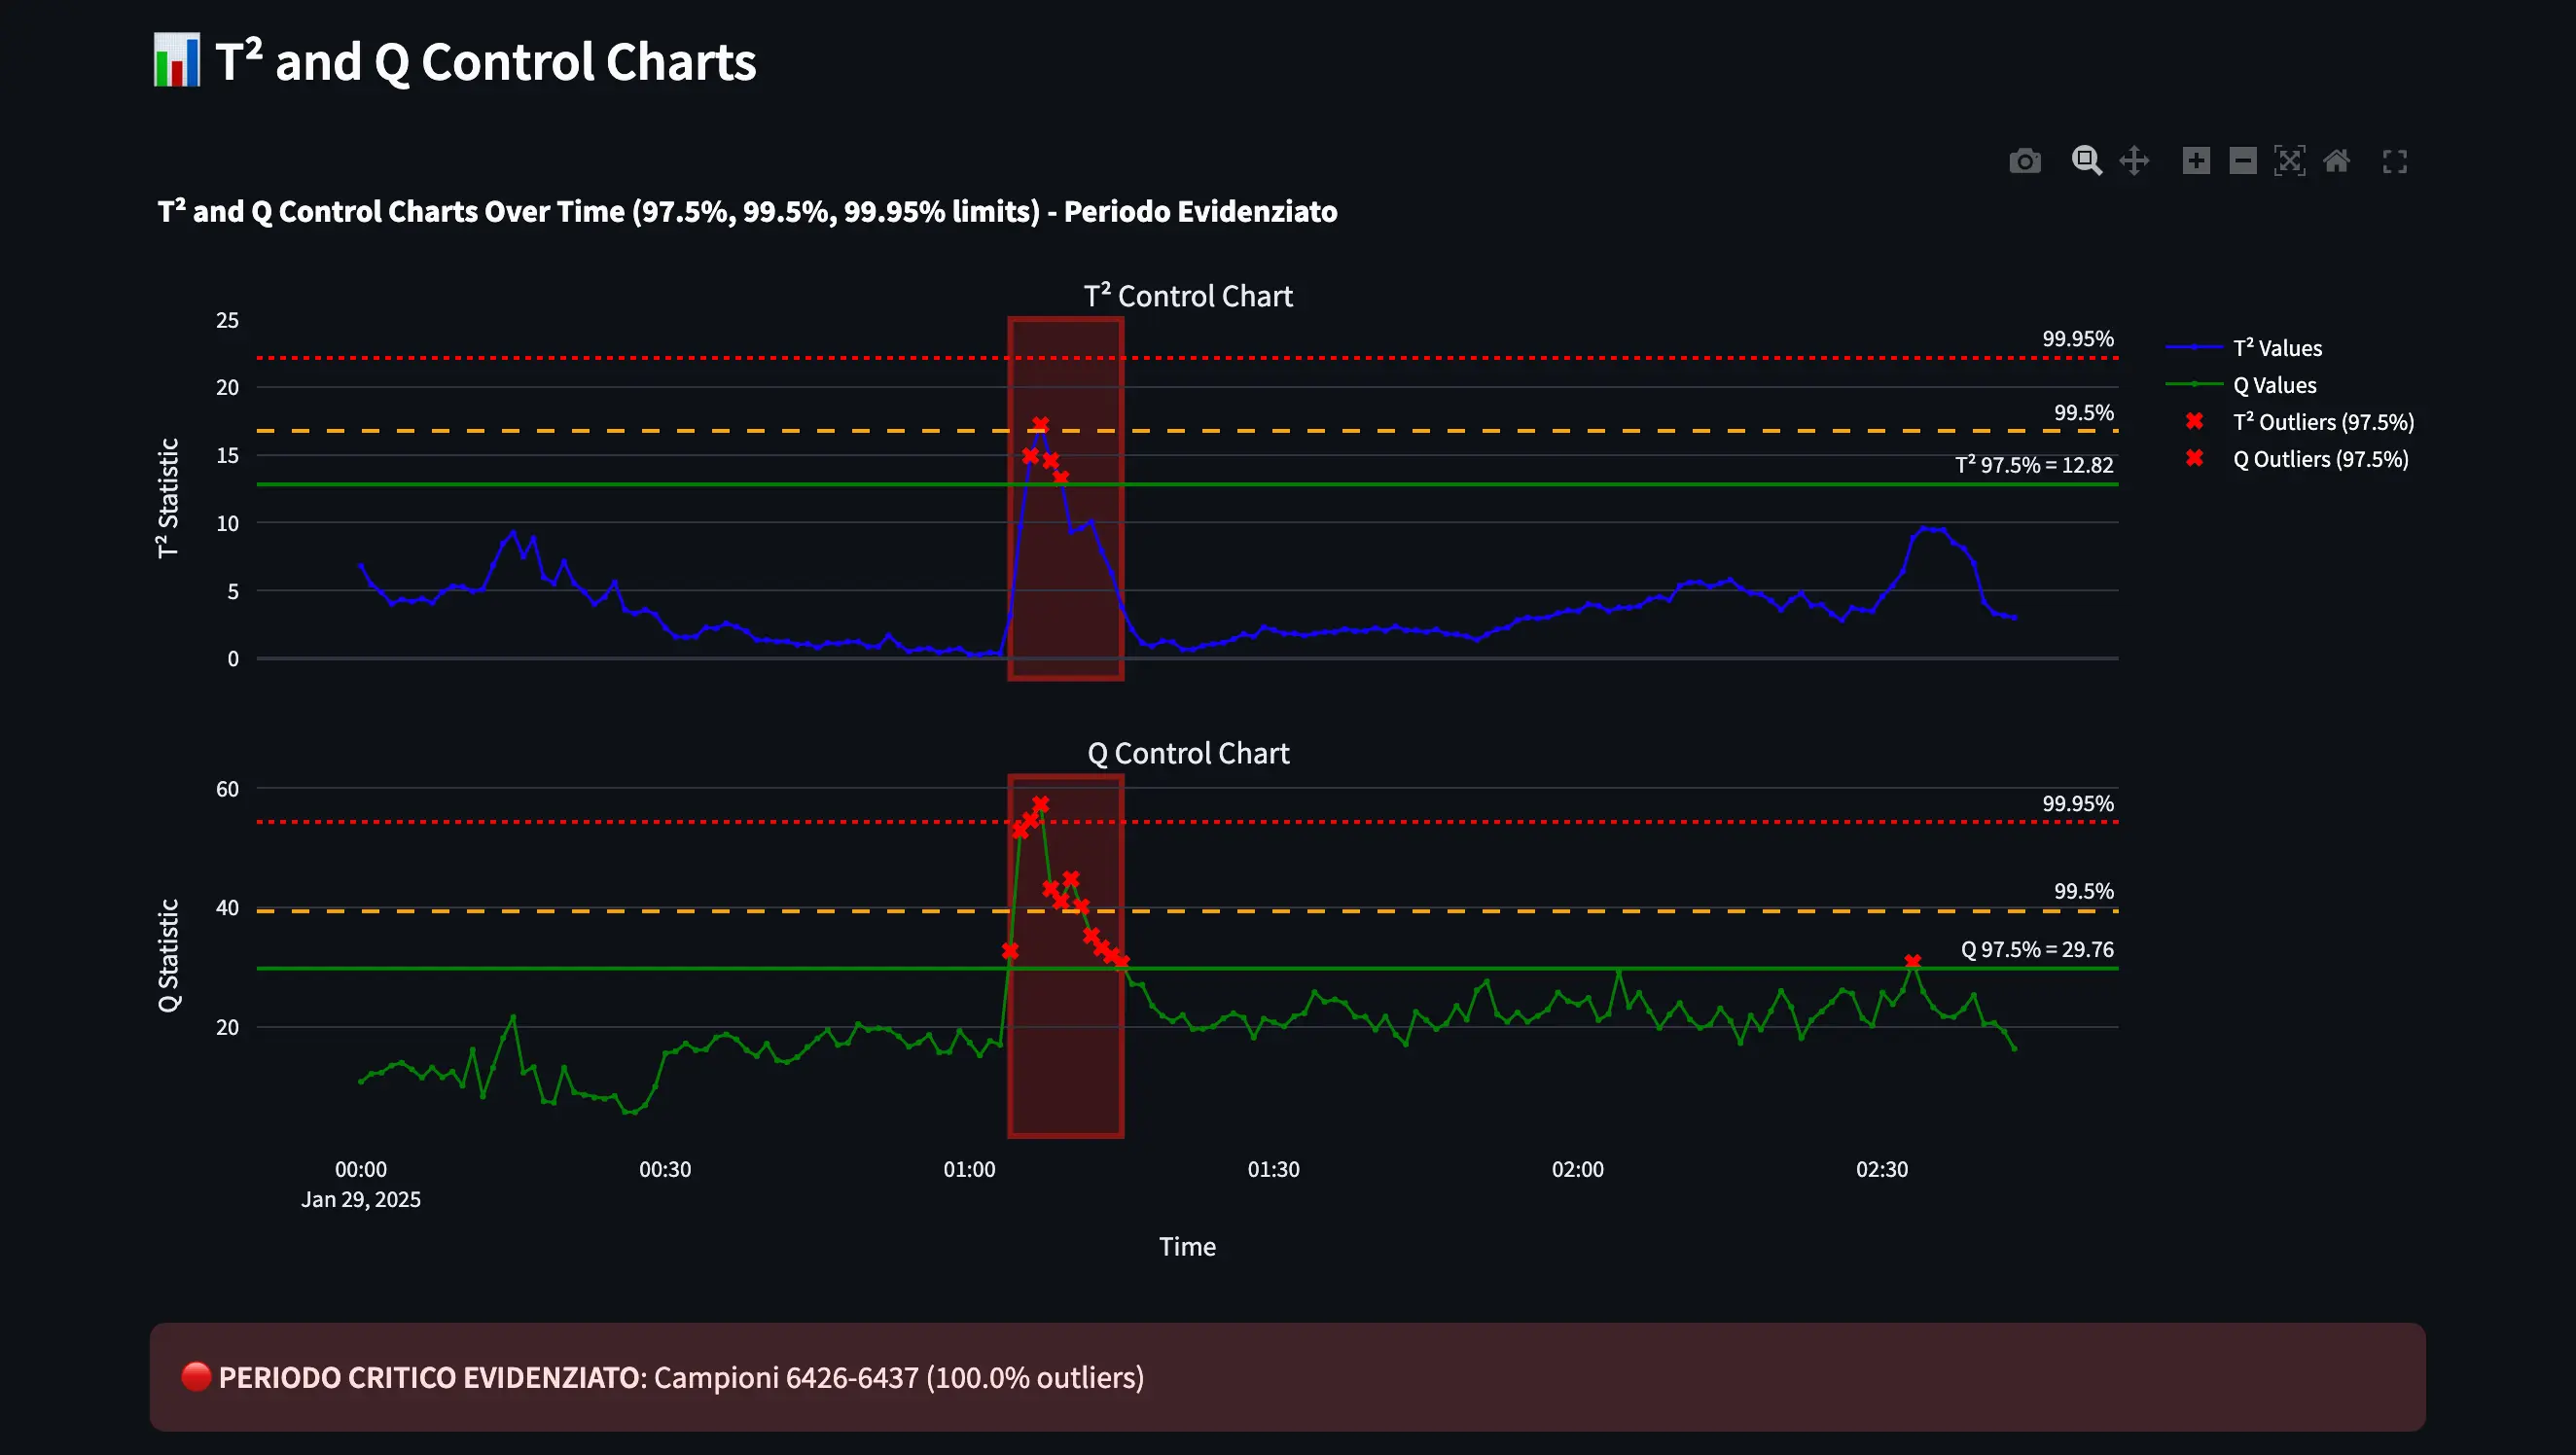
  • Process Monitoring Dashboards: Real-time multivariate control charts and quality metrics
  • Method Development Tools: Interactive DoE planning and optimization interfaces
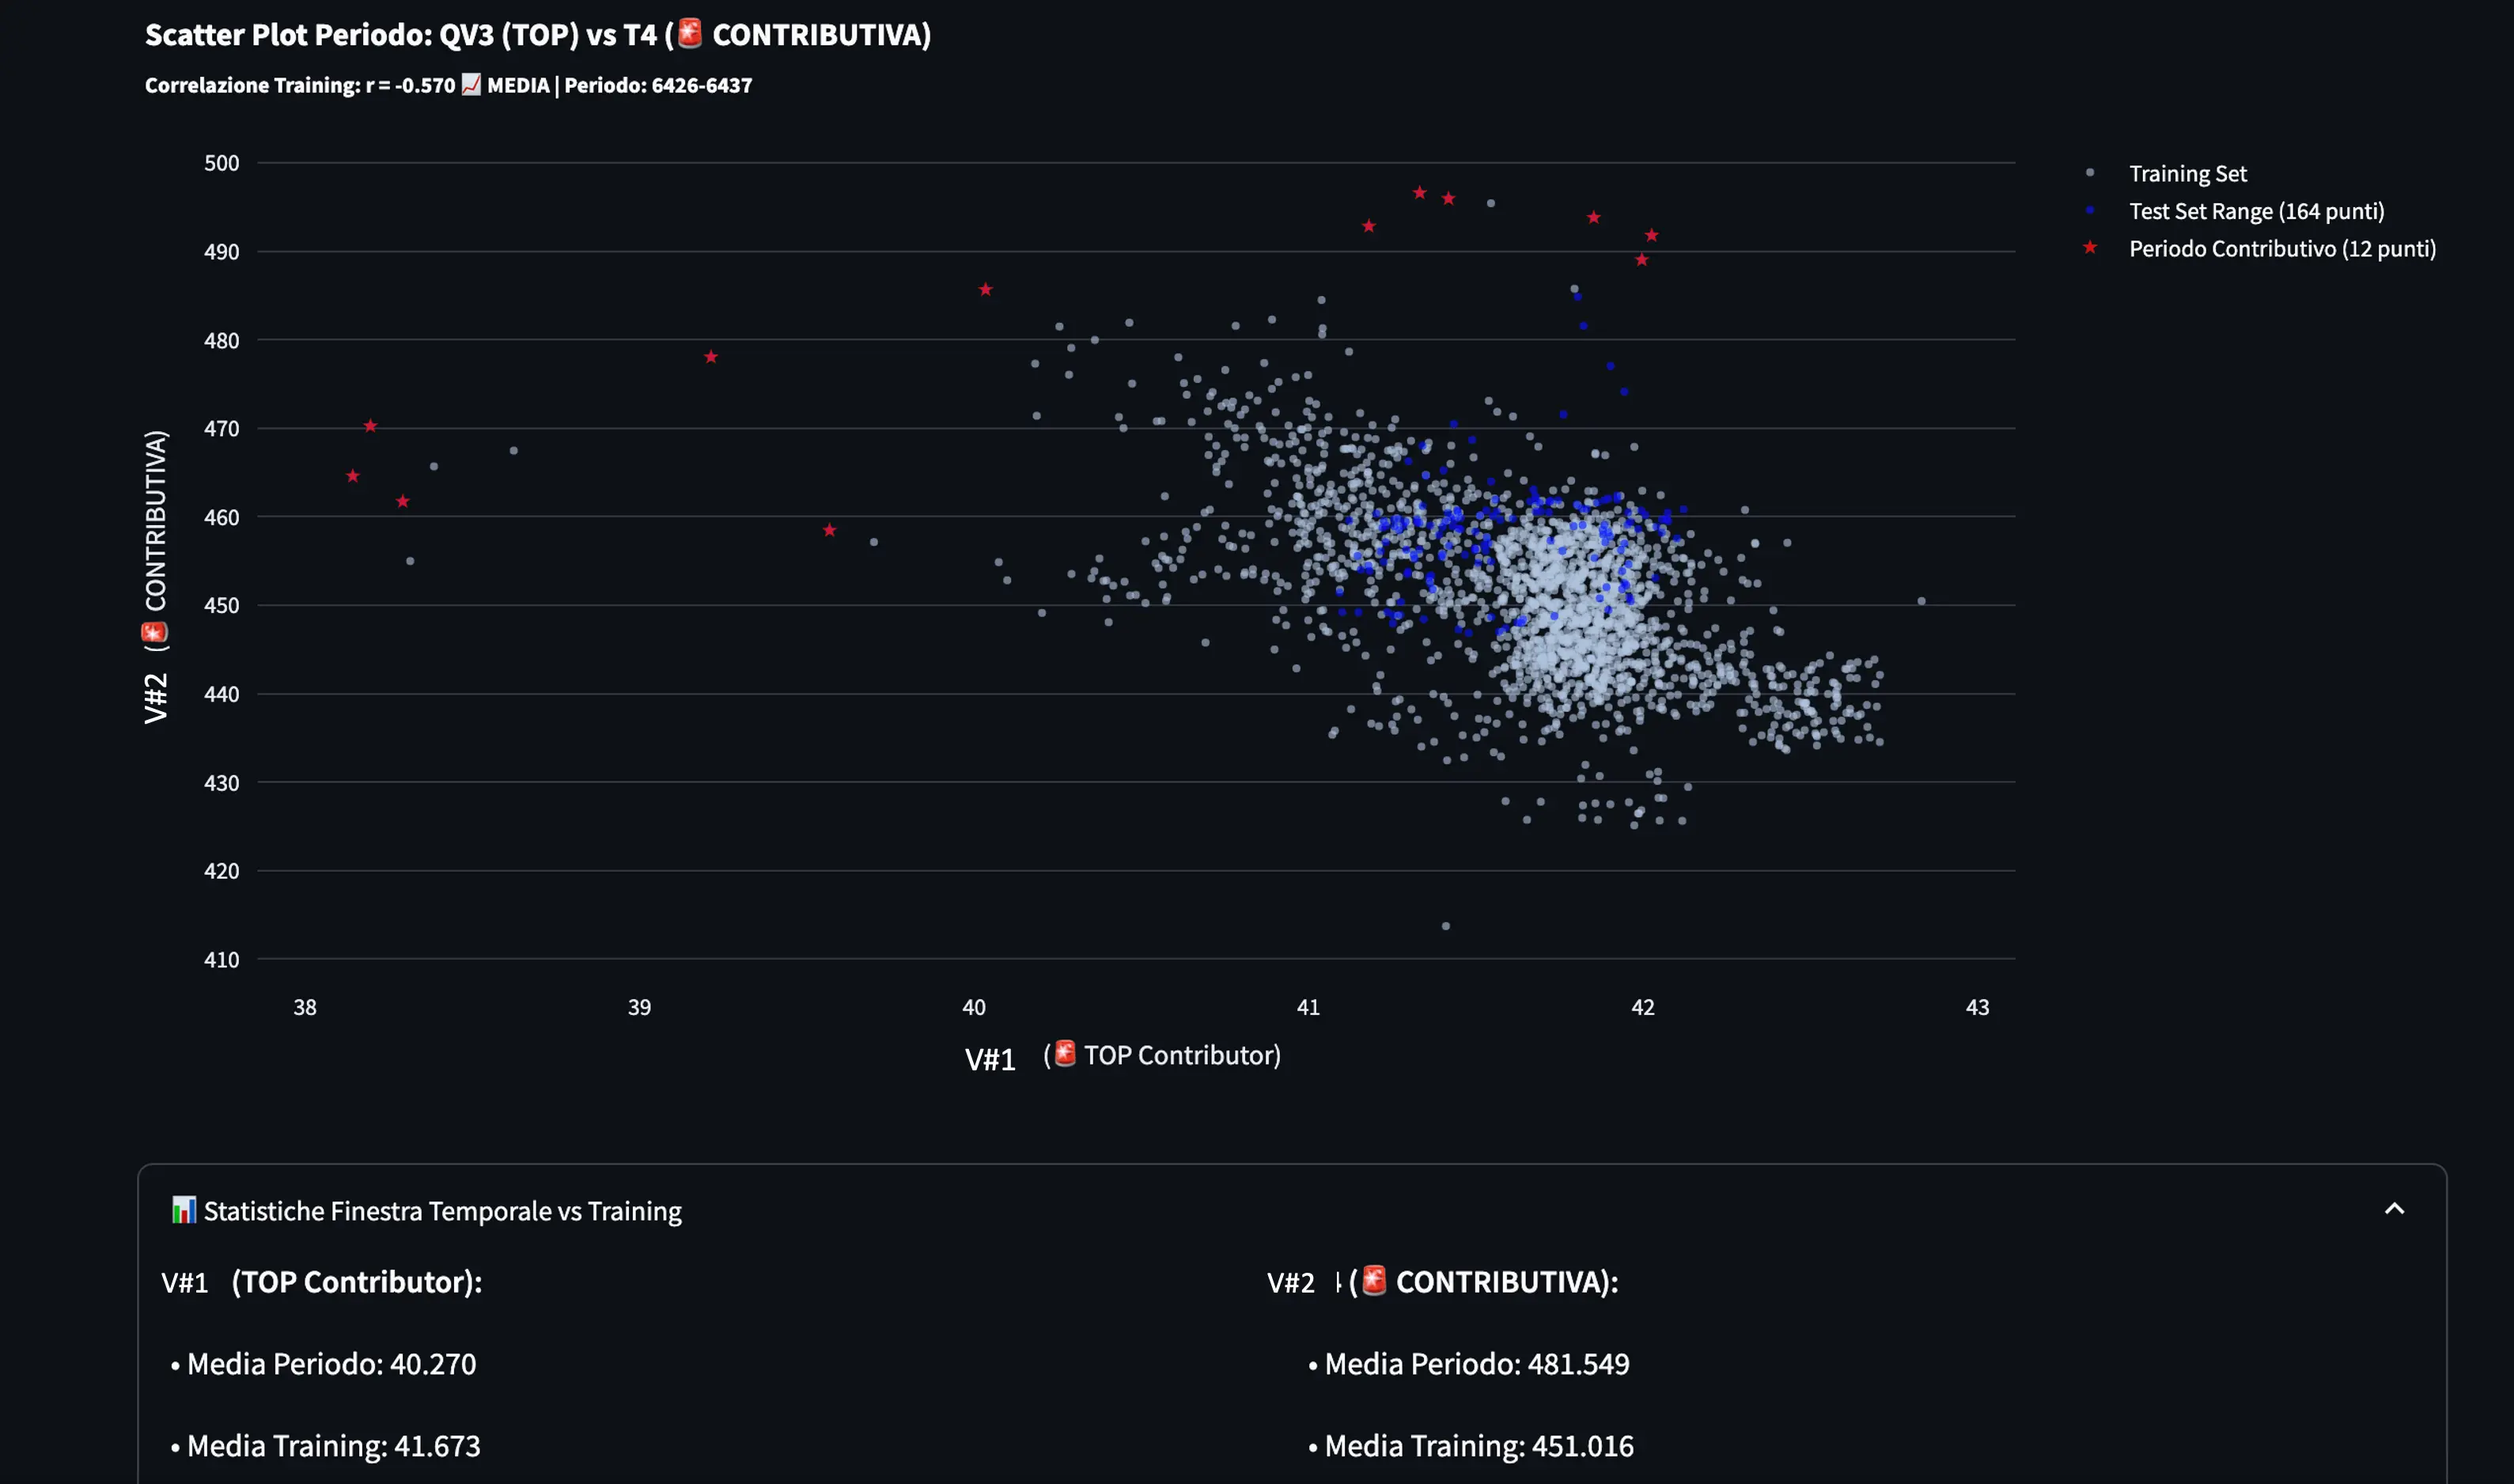
  • Data Analysis Platforms: Custom PCA, PLS, and classification workflows
  • Quality Control Systems: Automated batch release and trend analysis tools
  • UPLC Monte Carlo Pareto Optimizer: Advanced chromatographic method development tool with multi-objective optimization for separation analysis and extraction protocols
  • Regulatory Reporting: Automated generation of validation and compliance reports

Ready to discuss your custom software needs?

Get Custom Quote
Custom Streamlit Dashboard
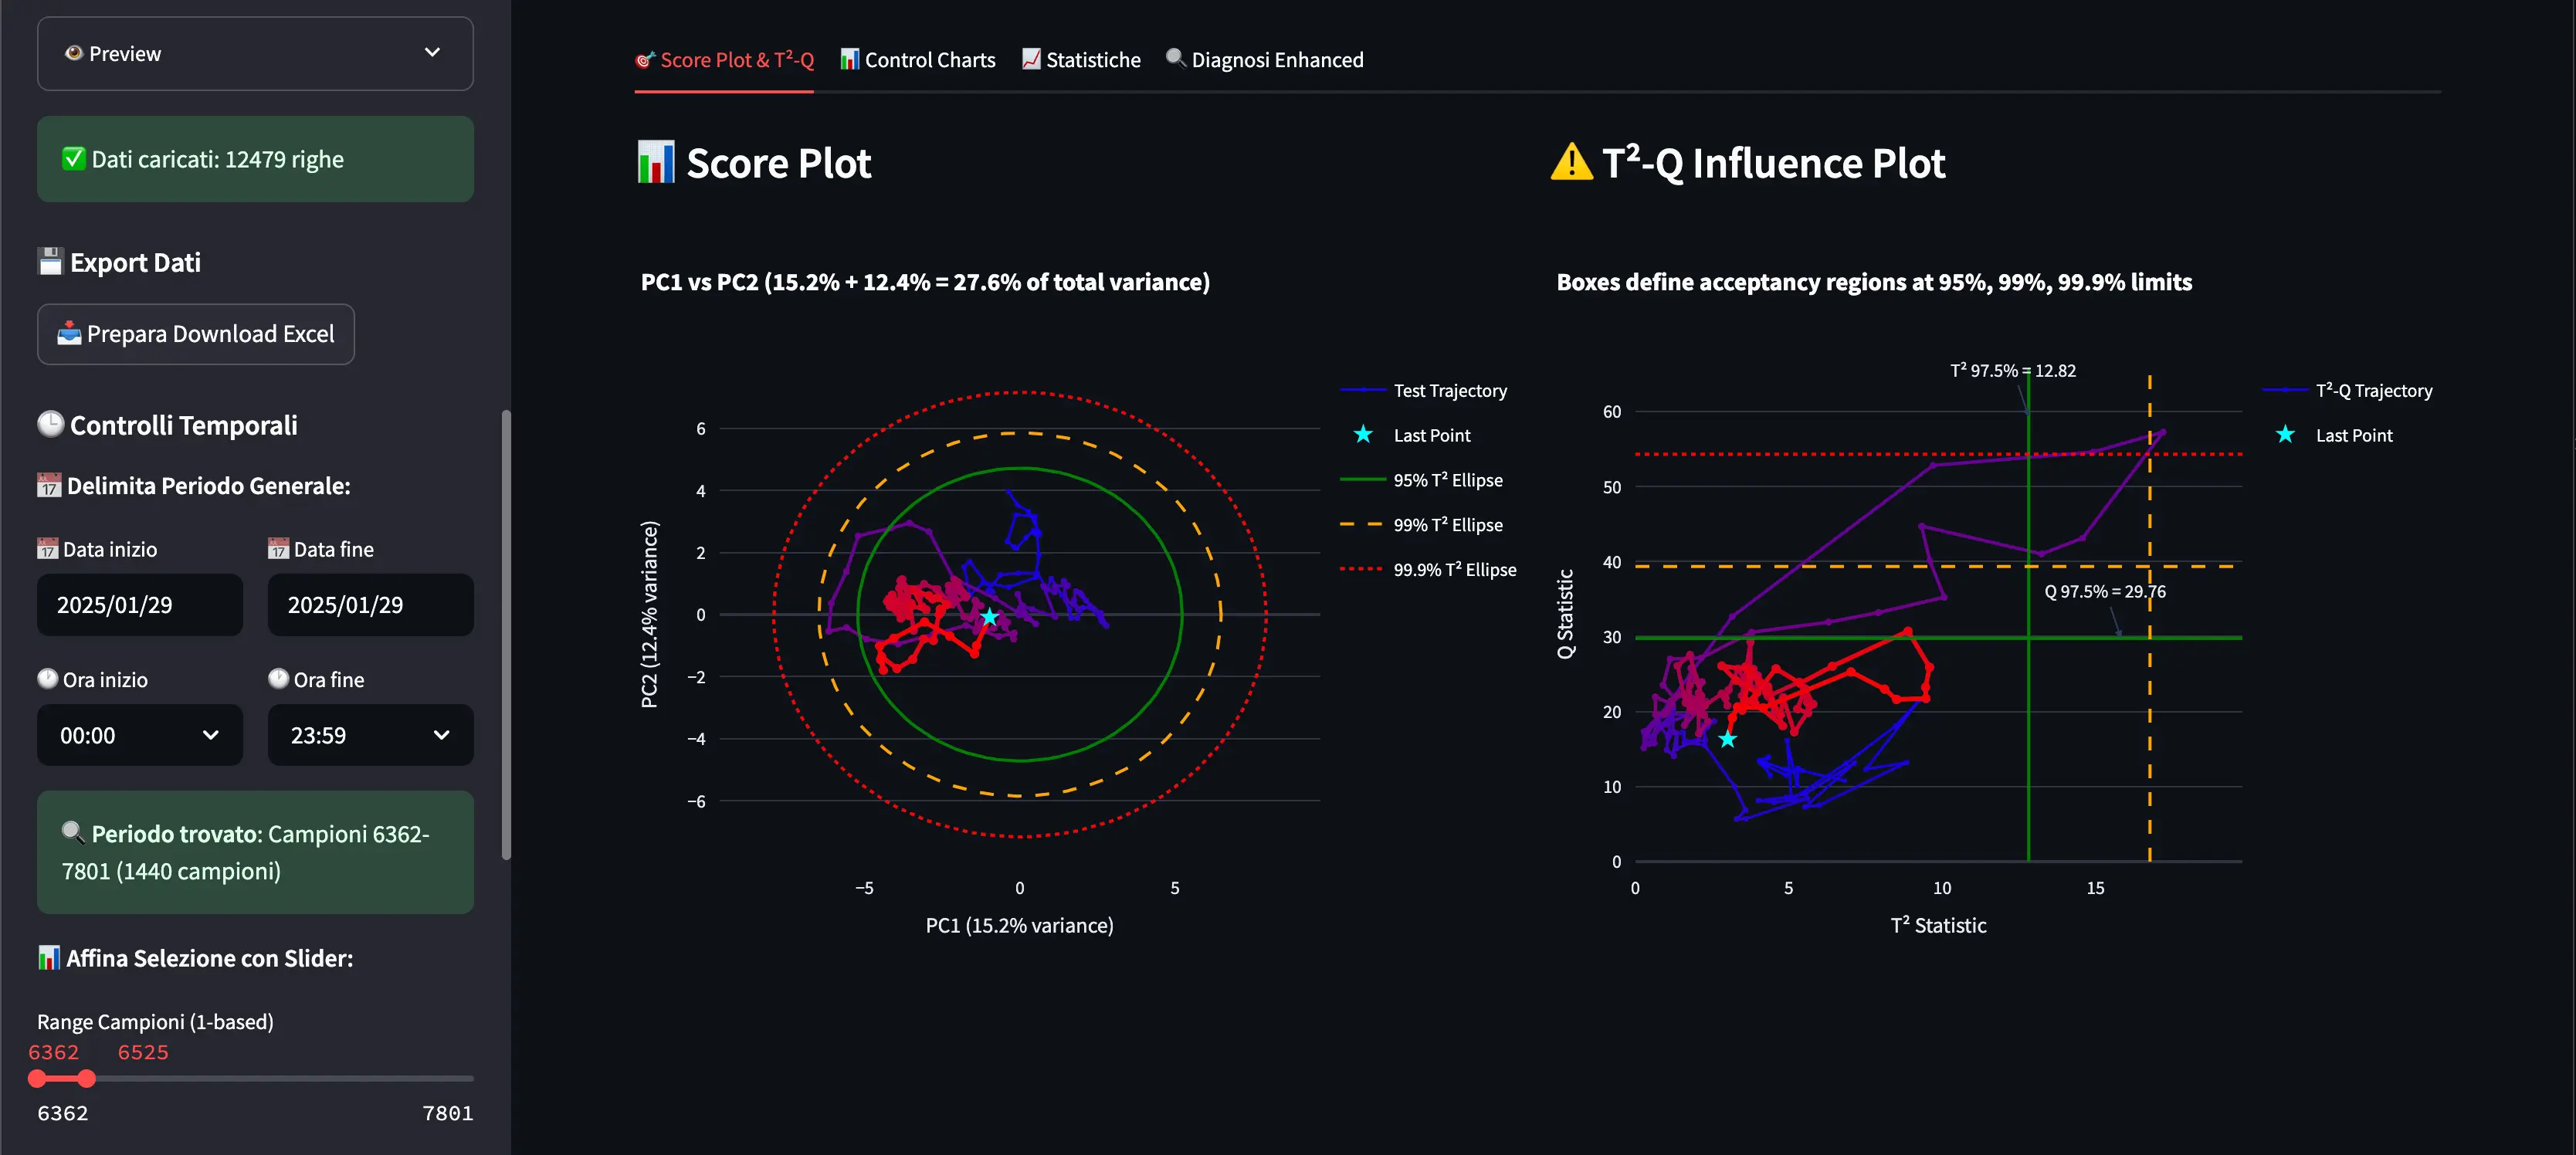
Example of a custom Streamlit web application for process monitoring
Custom Streamlit Analytics
Advanced analytics dashboard with interactive visualizations
Custom Process Control
Real-time process control and monitoring interface

Ready to transform your data analysis?

Download our free software today and discover the power of chemometrics in your research or industrial applications